Hi All,
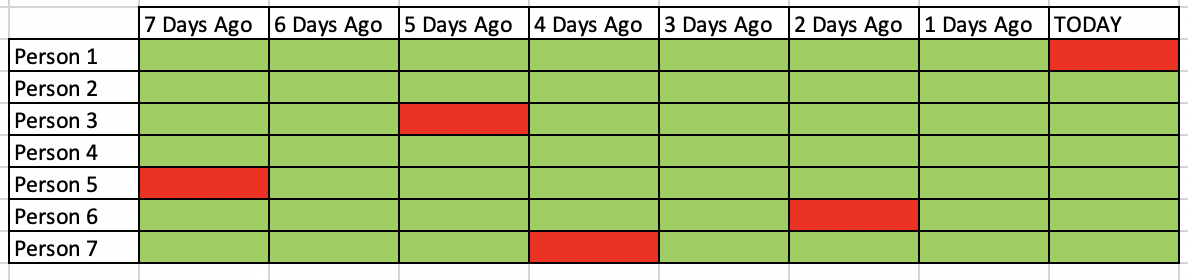
Not really a Wappler specific topic, but thought I’d ask the question and see if anyone has any ideas. I am trying to visualise some data and looking for some advice. Essentially I want to find a simple way of visualising the presence or absence of data for each person over the last 7 days. My initial thoughts are to create queries to pull this data from the database and then create some sort of a php table where a conditional in each cell looks for the presence of data for a certain person on a certain day. Does anyone have any ideas on a nice simple way to implement this.
Thanks in advance.
Community Page
Last updated:
Last updated: