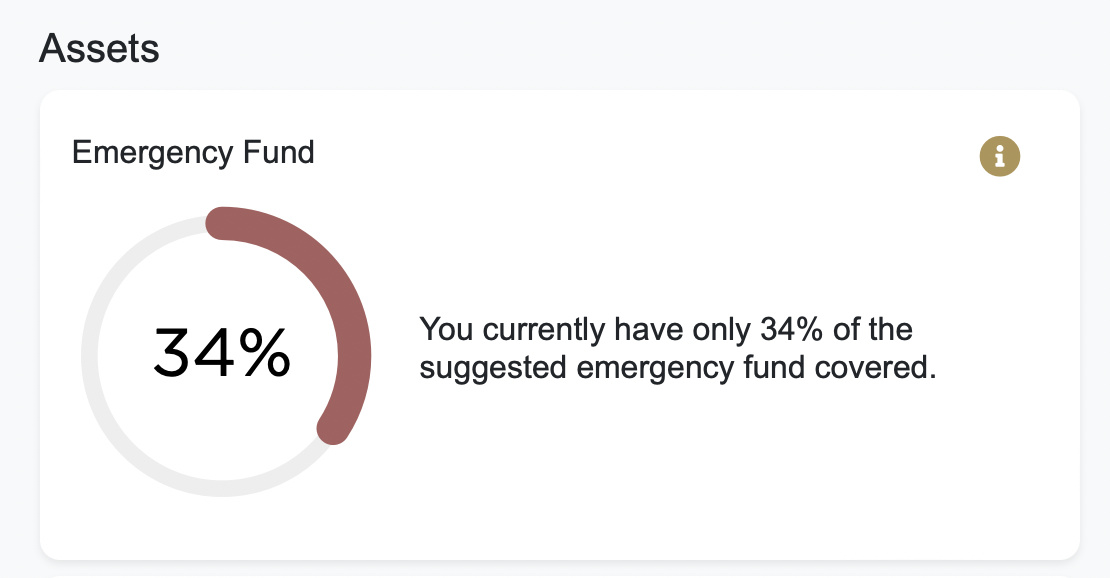
I want to use MKcharts to display basic circle charts as it cannot be done with App Connect Charts. This is what it looks like:
I’ve included the css and javascript on the page and a chart is displayed by adding code like this:
<div class="mkCharts d-inline" data-percent="34" data-size="150" data-color="#A8605F" data-stroke="4"></div>
So the value I want to use as dynamic is the data-percent which is defined in the javascript functions I included in the page:
function createCircleChart(percent, color, size, stroke) {
    let svg = `<svg class="mkc_circle-chart" viewbox="0 0 36 36" width="${size}" height="${size}" xmlns="http://www.w3.org/2000/svg">
        <path class="mkc_circle-bg" stroke="#eeeeee" stroke-width="${stroke * 0.5}" fill="none" d="M18 2.0845
              a 15.9155 15.9155 0 0 1 0 31.831
              a 15.9155 15.9155 0 0 1 0 -31.831"/>
        <path class="mkc_circle" stroke="${color}" stroke-width="${stroke}" stroke-dasharray="${percent},100" stroke-linecap="round" fill="none"
            d="M18 2.0845
              a 15.9155 15.9155 0 0 1 0 31.831
              a 15.9155 15.9155 0 0 1 0 -31.831" />
        <text class="mkc_info" x="50%" y="50%" alignment-baseline="central" text-anchor="middle" font-size="8">${percent}%</text>
    </svg>`;
    return svg;
}

let charts = document.getElementsByClassName('mkCharts');

for(let i=0;i<charts.length;i++) {
    let chart = charts[i];
    let percent = chart.dataset.percent;
    let color = ('color' in chart.dataset) ? chart.dataset.color : "#2F4F4F";
    let size = ('size' in chart.dataset) ? chart.dataset.size : "100";
    let stroke = ('stroke' in chart.dataset) ? chart.dataset.stroke : "1";
    charts[i].innerHTML = createCircleChart(percent, color, size, stroke);
}
How can I use my dataset value together with the data tag in the html? - just adding dmx-bind:data-percent=“34” gives me undefined on the page.
Community Page
Last updated:
Last updated: