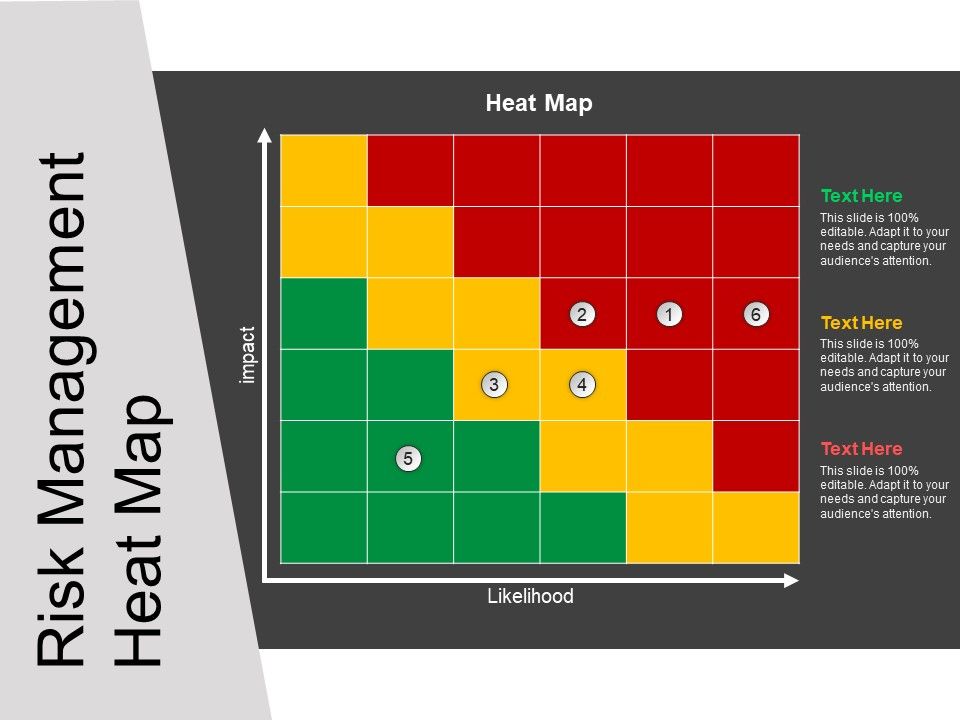
Hi, I’m trying to create a heatmap (55 matrix which you plot data on) and i would ideally like to be able to colour each block in the matrix a colour signifying the importance Green, Red and Amber (see attached image happens to be 66). Alternatively is it possible to have a background image which has the colours on with the graph plotting the co-ordinates over the image?
Is this possible?
Thanks
Community Page
Last updated:
Last updated:
