Hi,
I have a page which loads a few server connects on page load, and has a bit comprehensive UI with lots of buttons, lists, collapses etc.
Once all server actions/connects are loaded, the UI is drawn & Chrome stops showing ‘loading…’, I see in the Chrome task manager that page is using 100+ in CPU.
After a few seconds, without even doing anything on the page, it restores to 0-10 CPU usage.
Then, on click of a button, I load up a route. All ok still.
On this route, on click of an item in list, I load another server connect which binds to a list of 300+ items with 5-6 elements on each row (li).
Once this server connect is loaded and UI is drawn I can still see CPU usage at 100+ for about 40-60 seconds until it restores back to 0-10.
And this is all before I even start to interact with the new list.
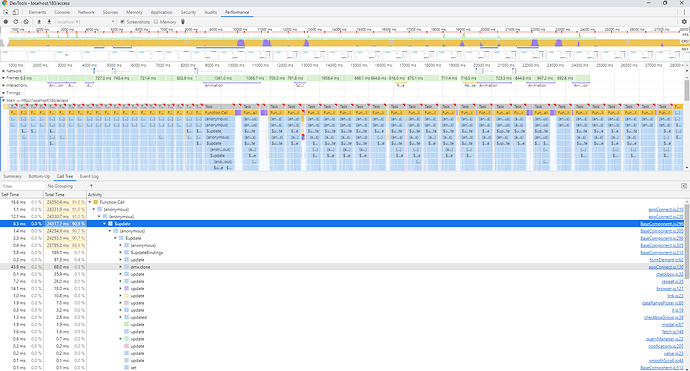
I ran a performance snapshot and the results show intensive AppConnect.js use. Screenshot attached.
Can someone please help me understand what it is that I should change to optimize memory/CPU usage?
Last time I had such an issue, I used Conditional Region on suggestion of @Teodor, and it worked quite well for me. Even here, I have already placed lots of sections in conditional regions, but there’s something still taking up CPU resource.
Please help.
Last updated:
