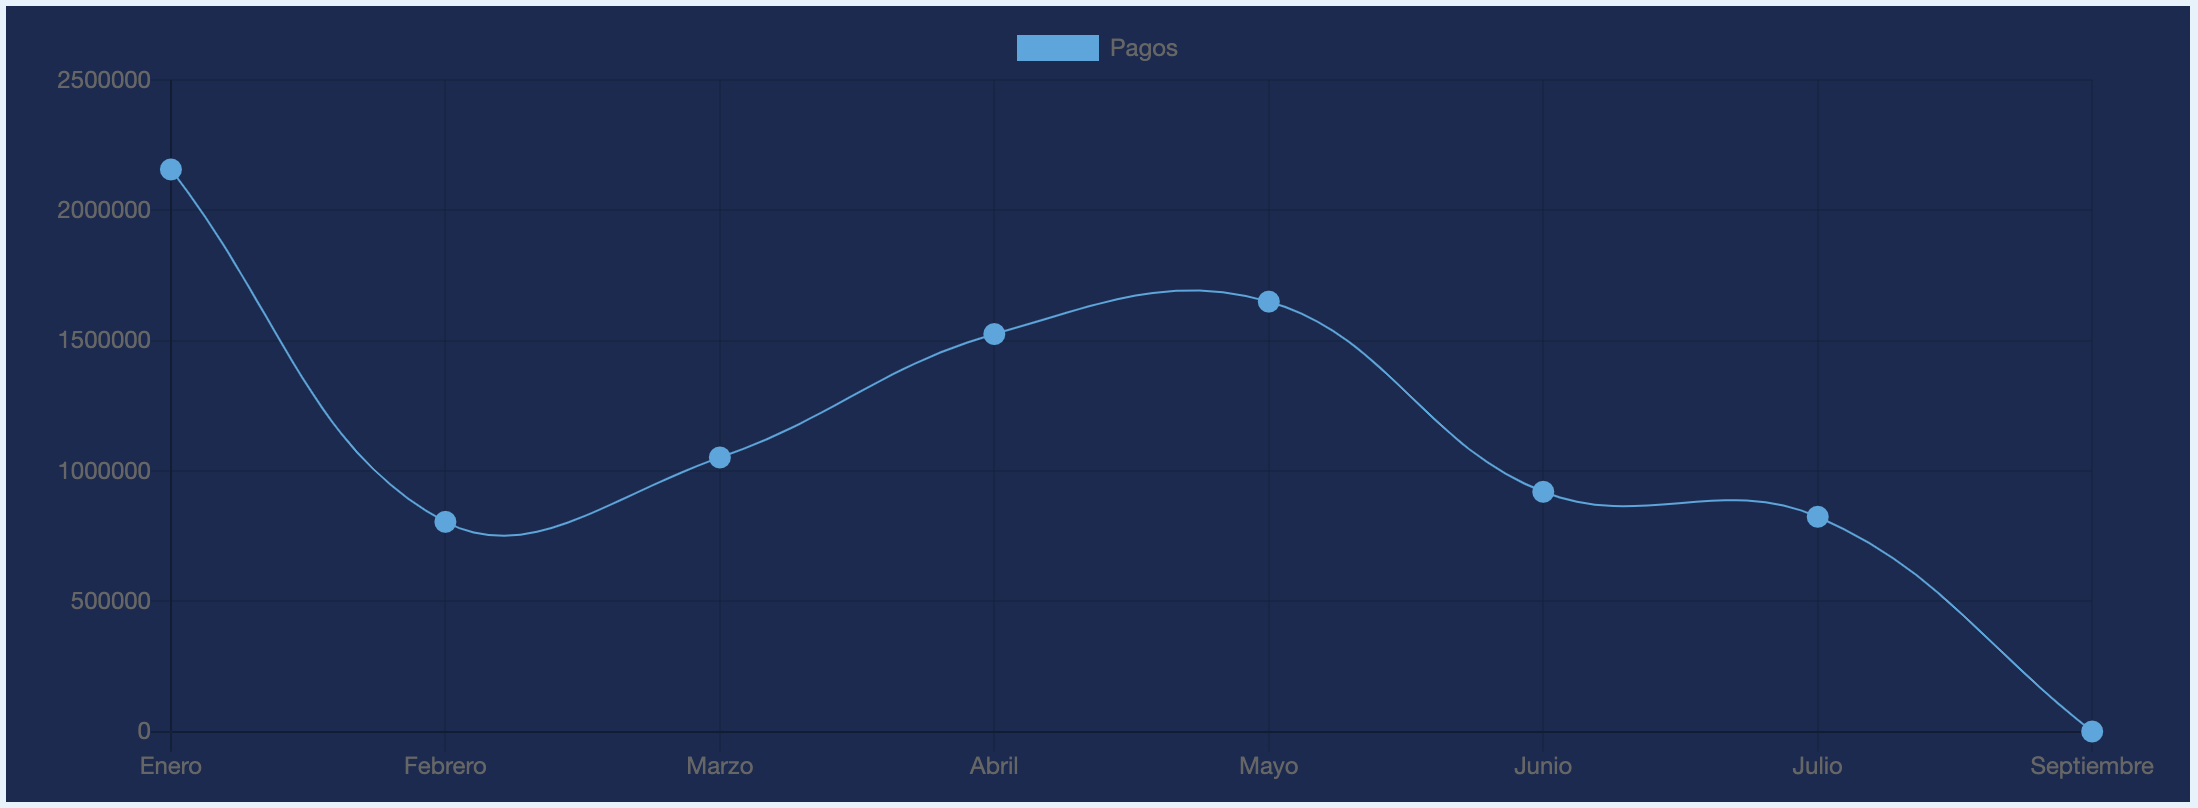
Hi, I have this chart with a dark blue background and I would like to change the color of the font and the grid lines to white so they can be seen.
I’ve been going through the documentation of charts.js and tried to change the color like this:
dmx-bind:defaultColor = "#fff"

dmx-bind:color = "#fff"

and of corse with
color="#fff"
Unsuccessfully
I also saw this post: howto/how-to-set-the-colour-of-a-donut-chart/17276
Where @Patrick talked about how to change the color of the data line.
I know I can go to the file Chart.min.js and change the color by hand, but I prefer not to do it that way.
(R._set ("global", {defaultColor: "rgba (0,0,0,0.1)", defaultFontColor: "# 666", defaultFontFamily: "'Helvetica Neue', 'Helvetica', 'Arial', sans- serif ")
Any suggestions will be appreciated. Thanks in advance
Community Page
Last updated:
Last updated: