Hi All
Sorry if this is a long post I have tried my hardest to figure this out before asking but I need some help/guidance on how to get API data to display on Charts.
Here is some sample data and fields that i can pull from the API
{
“data”: [
{
“group”: “https://www.*.com/api/v2/groups/328823/",
“state”: “offline”,
},
{
“group”: "https://www..com/api/v2/groups/275089/”,
“state”: “offline”,
},
Basically the API reports on a number of devices that are divided into a number of groups and i am hoping to have a 1 bar chart per group reporting on how many devices in that group are online or offline.
I’ve tried a view different ways but get stuck
Way 1.
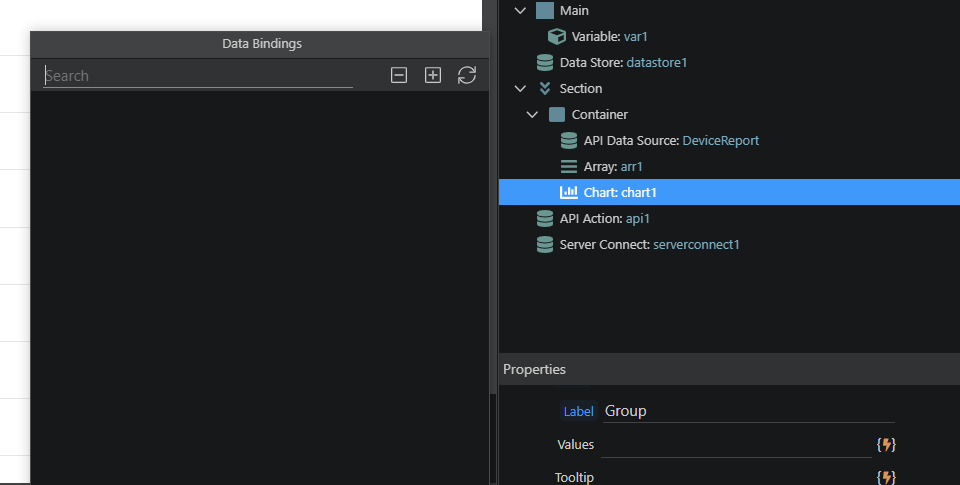
Created an API date source and then used this as a data source in my chart (asslso tried a serve connect as a source to)
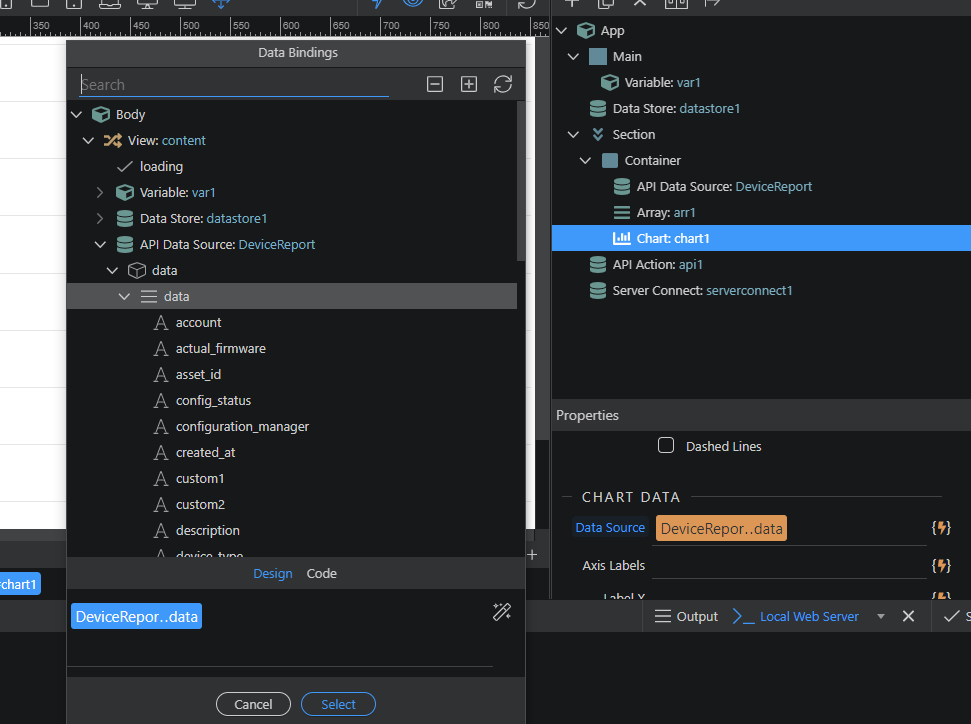
but I get no values when i try and find them
Way 2 , User server Actions to grab the data from the API Every 30 seconds and put it into a database, then use Database Queries to do counts of the state of each device in each Group.
Created a schedule to run my API server action every 30 secs
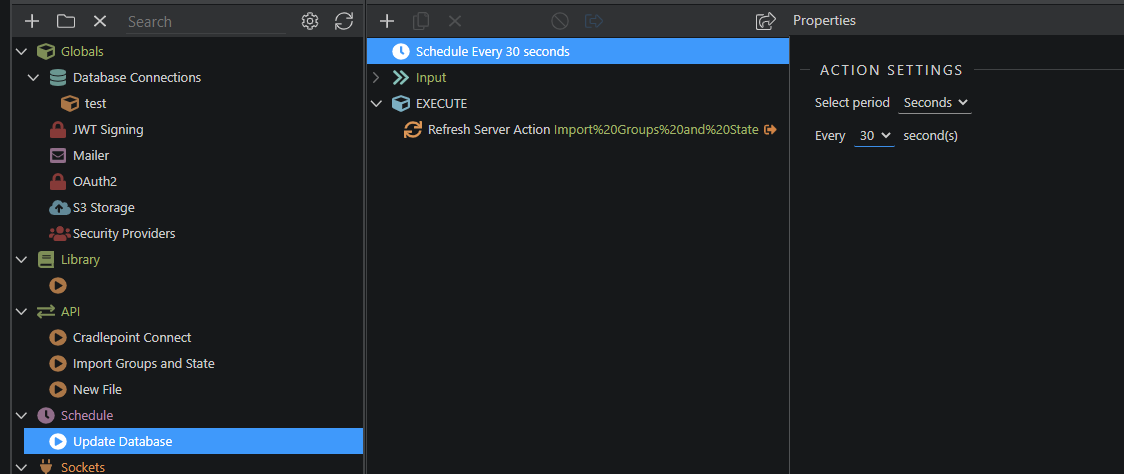
I have set the server action as so
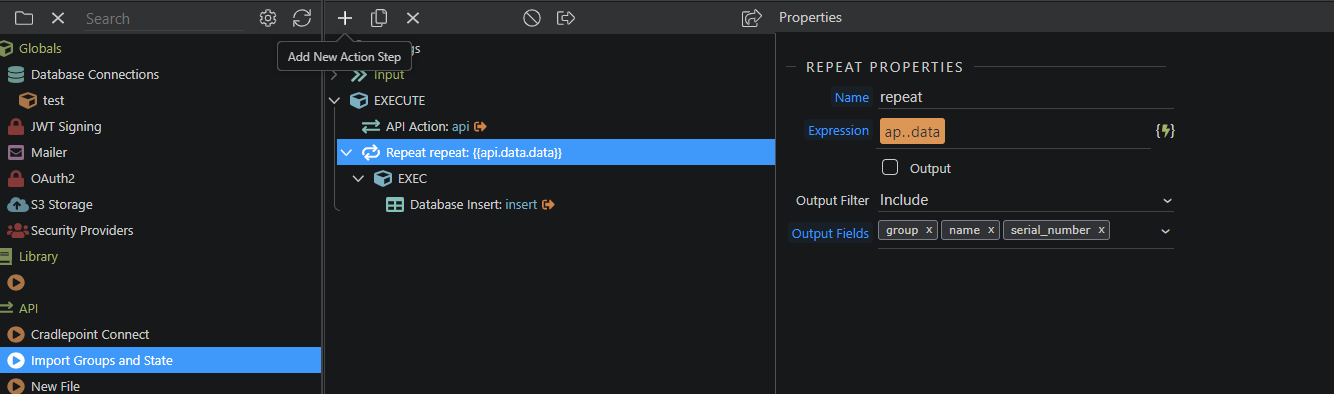
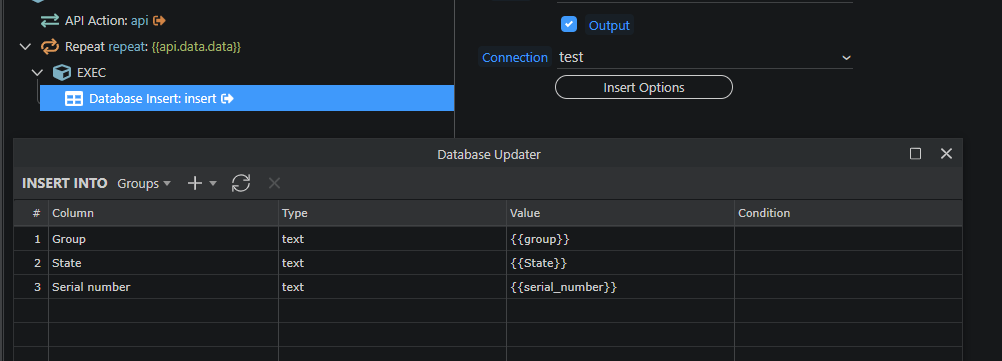
Did think of using Database Multi Update instead, as the data will be updated every 30 seconds, but just want it working via Database Insert first)
However, the data does not seem to appear in the database
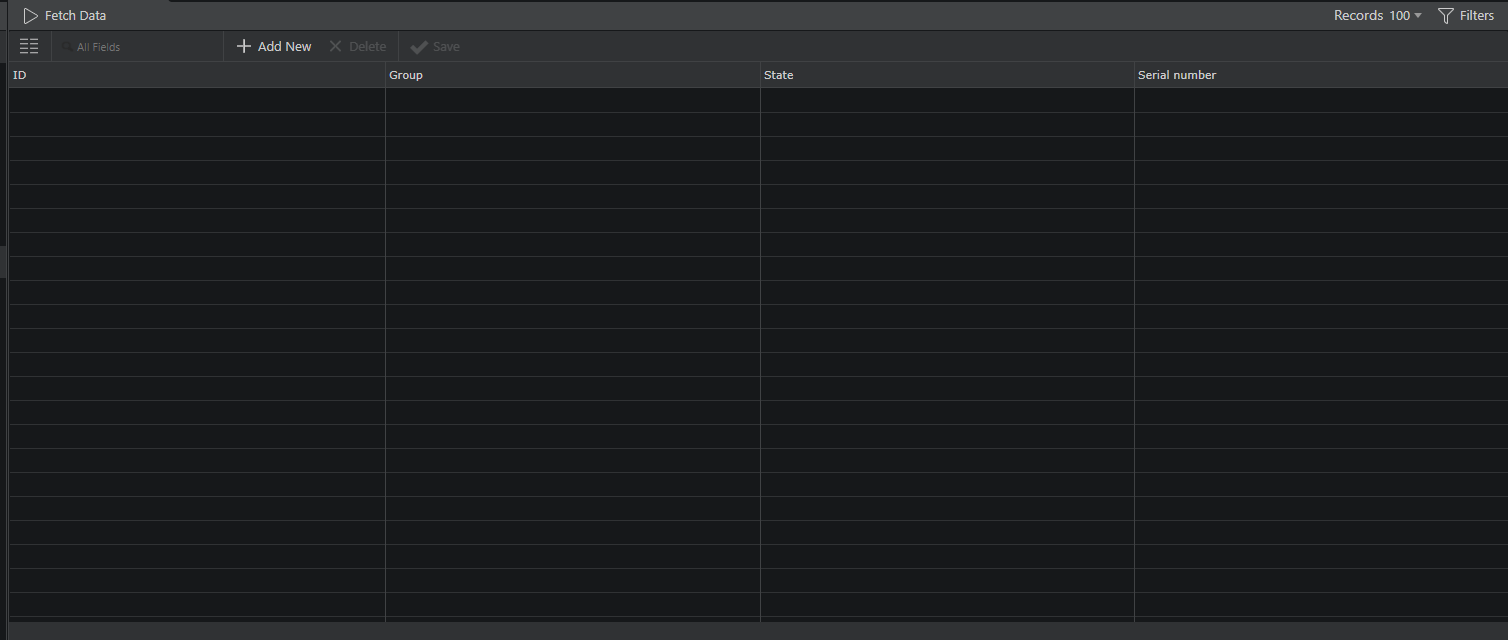
So I’m stuck on getting this working
I know there’s allot to process here and have tried doing it myself, but any help here will be appreciated 
Thanks
Craig
Last updated: