Hi All,
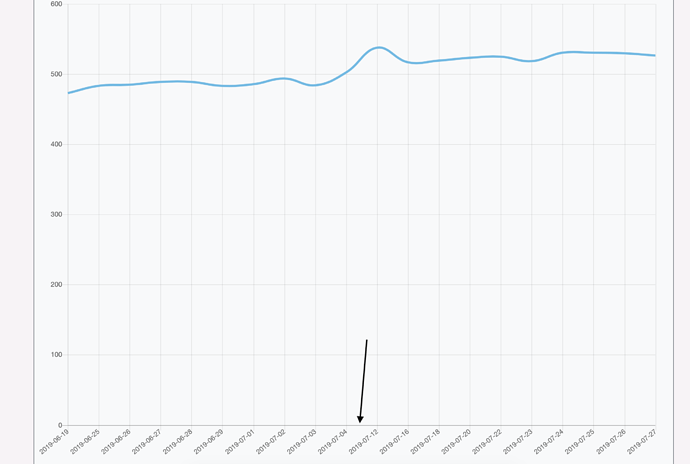
I am hoping someone can help me with something. I am trying to create a line graph where the x axis is DATETIME. See image attached. The graph does not seem to recognise that this axis is a DATETIME value and does not space out the x axis correctly. Does anyone know how to resolve this? Apologies if I have missed something in the documentation.
Community Page
Last updated:
Last updated:
